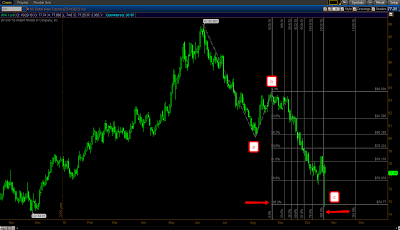
The Toronto Stock index is tracing out a very interesting pattern. So far it has formed an exact replica of the topping pattern from 2008. Hank Wernicki's theory is that markets operate in chaos until a fractal appears bringing order, and a turning point in price upon completion of a fractal pair. The first fractal is the parent, the second is the child in this case. From a trading perspective, the appearance of the pair allows for a low risk entry usually close to top tick. Since most of the global markets are in sinc a turn in this index would coincide with a turn in the DOW, etc. This pair is appearing right where you would expect it to considering the overwhelming bullish sentiment, etc. I'm thnking sell the QE2.
Saturday, October 30, 2010
Thursday, October 28, 2010
Wednesday, October 27, 2010
Saturday, October 23, 2010
Fibo's are telling me the top is in
As shown on the charts, there is a convergence of fibo extensions that come together at this exact point in time. The bottom line is that index markets are scheduled for a turn starting now. It's my experience that time relationships can be uncanny in their ability to turn a market, sometimes to the minute. If the markets are anything other than red from here then IMO it's time to start looking for bullish entry points. If the Dow takes out the high from April then not only did the fractal road map that has been in place for 2 years fail, but both time and price were unable to turn the market and we can expect bullish markets and inflation in the months ahead. I really think the top is in, but price will be the ultimate decision maker.
Friday, October 22, 2010
Thursday, October 21, 2010
Wednesday, October 20, 2010
Copper short entry
Kiss the underside of the broken trend line, 5 down, 3 up, A=C, 61.8% retracement, 100% time extension, what's not to like?
Friday, October 8, 2010
Thursday, October 7, 2010
Tuesday, October 5, 2010
Sunday, October 3, 2010
Subscribe to:
Posts (Atom)


